Membership Numbers Revisited
In the July-September 2017 issue of NewsScope, (“The AAGL Is Staying Young as It Gets Older”) I referenced two trends that membership numbers were showing. The first was the continuing trend that the largest percentage of new members were younger (31-40 years old) and secondly the majority of new members over the past 5 years were women.
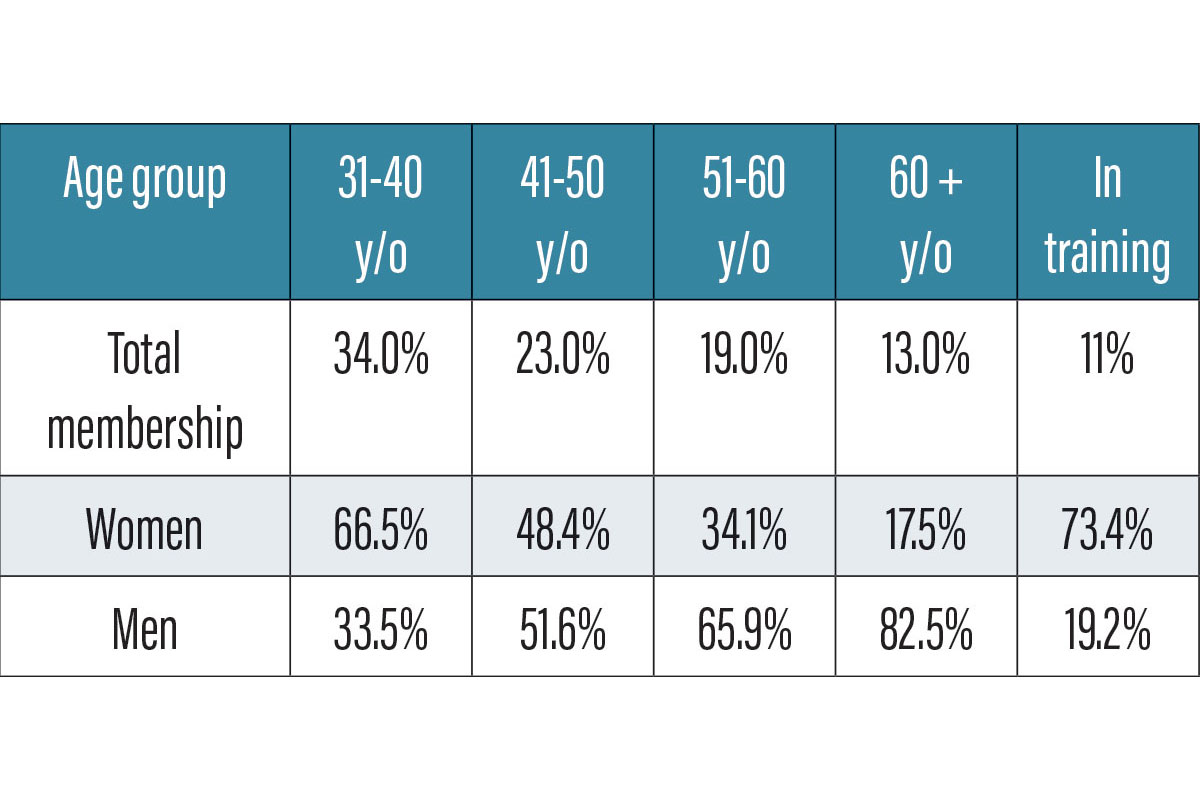
The AAGL recently established a committee to update its long standing anti-harassment and diversity policies (see the article by Dr. Jubliee Brown on page 8). With this initiative in mind the membership figures were broken down into the numbers of female and male in each age group (see chart).
But are these numbers being fairly represented in educational and leadership positions within AAGL? I believe the answer is yes. Others may disagree, but women surgeons currently comprise 50% of the AAGL Executive Committee, 42% of the Board of Directors, and the most recent and next 2 annual meeting Scientific Program Chairs. These are senior leadership positions and it would not be expected that they be chosen from either the youngest or the oldest members.
On the other hand, academic leadership should be represented by surgeons who have demonstrated their skills and teaching abilities. These leaders have the responsibility of mentoring younger members. The AAGL is accomplishing this by including young colleagues as junior faculty in most programs.
Clearly in the past men have dominated many positions but that is not what is trending in the AAGL. I believe we should be pleased the AAGL is responding much better than many similar organizations to our demographic changes.


